Appendix C LumpyThroughout the book, I have used diagrams to represent the state of running programs. In Section 2.2, we used a state diagram to show the names and values of variables. In Section 3.10 I introduced a stack diagram, which shows one frame for each function call. Each frame shows the parameters and local variables for the function or method. Stack diagrams for recursive functions appear in Section 5.9 and Section 6.5. Section 10.2 shows what a list looks like in a state diagram, Section 11.4 shows what a dictionary looks like, and Section 12.6 shows two ways to represent tuples. Section 15.2 introduces object diagrams, which show the state of an object’s attributes, and their attributes, and so on. Section 15.3 has object diagrams for Rectangles and their embedded Points. Section 16.1 shows the state of a Time object. Section 18.2 has a diagram that includes a class object and an instance, each with their own attributes. Finally, Section 18.8 introduces class diagrams, which show the classes that make up a program and the relationships between them. These diagrams are based on the Unified Modeling Language (UML), which is a standardized graphical language used by software engineers to communicate about program design, especially for object-oriented programs. UML is a rich language with many kinds of diagrams that represent many kinds of relationship between objects and classes. What I presented in this book is a small subset of the language, but it is the subset most commonly used in practice. The purpose of this appendix is to review the diagrams presented in the previous chapters, and to introduce Lumpy. Lumpy, which stands for “UML in Python,” with some of the letters rearranged, is part of Swampy, which you already installed if you worked on the case study in Chapter 4 or Chapter 19, or if you did Exercise 4, Lumpy uses Python’s inspect module to examine the state of a running program and generate object diagrams (including stack diagrams) and class diagrams. C.1 State diagram
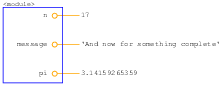
Here’s an example that uses Lumpy to generate a state diagram. from swampy.Lumpy import Lumpy lumpy = Lumpy() lumpy.make_reference() message = 'And now for something completely different' n = 17 pi = 3.1415926535897932 lumpy.object_diagram() The first line imports the Lumpy class from swampy.Lumpy. If you don’t have Swampy installed as a package, make sure the Swampy files are in Python’s search path and use this import statement instead: from Lumpy import Lumpy The next lines create a Lumpy object and make a “reference” point, which means that Lumpy records the objects that have been defined so far. Next we define new variables and invoke Figure C.1 shows the result. The graphical style is different from what I showed earlier; for example, each reference is represented by a circle next to the variable name and a line to the value. And long strings are truncated. But the information conveyed by the diagram is the same. The variable names are in a frame labeled You can download this example from http://thinkpython.com/code/lumpy_demo1.py. Try adding some additional assignments and see what the diagram looks like. C.2 Stack diagram
Here’s an example that uses Lumpy to generate a stack diagram. You can download it from http://thinkpython.com/code/lumpy_demo2.py. from swampy.Lumpy import Lumpy
def countdown(n):
if n <= 0:
print 'Blastoff!'
lumpy.object_diagram()
else:
print n
countdown(n-1)
lumpy = Lumpy()
lumpy.make_reference()
countdown(3)
Figure C.2 shows the result. Each frame is represented with a box that has the function’s name outside and variables inside. Since this function is recursive, there is one frame for each level of recursion. Remember that a stack diagram shows the state of the program at
a particular point in its execution. To get the diagram you want,
sometimes you have to think about where to invoke In this case I invoke C.3 Object diagrams
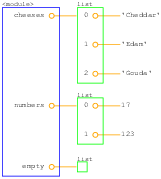
This example generates an object diagram showing the lists from Section 10.1. You can download it from http://thinkpython.com/code/lumpy_demo3.py. from swampy.Lumpy import Lumpy lumpy = Lumpy() lumpy.make_reference() cheeses = ['Cheddar', 'Edam', 'Gouda'] numbers = [17, 123] empty = [] lumpy.object_diagram() Figure C.3 shows the result. Lists are represented by a box that shows the indices mapping to the elements. This representation is slightly misleading, since indices are not actually part of the list, but I think they make the diagram easier to read. The empty list is represented by an empty box.
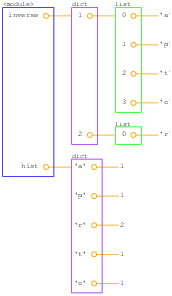
And here’s an example showing the dictionaries from Section 11.4. You can download it from http://thinkpython.com/code/lumpy_demo4.py. from swampy.Lumpy import Lumpy
lumpy = Lumpy()
lumpy.make_reference()
hist = histogram('parrot')
inverse = invert_dict(hist)
lumpy.object_diagram()
Figure C.4 shows the result. hist is a dictionary that maps from characters (single-letter strings) to integers; inverse maps from integers to lists of strings.
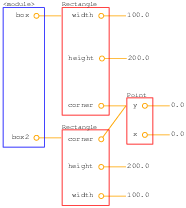
This example generates an object diagram for Point and Rectangle objects, as in Section 15.6. You can download it from http://thinkpython.com/code/lumpy_demo5.py. import copy from swampy.Lumpy import Lumpy lumpy = Lumpy() lumpy.make_reference() box = Rectangle() box.width = 100.0 box.height = 200.0 box.corner = Point() box.corner.x = 0.0 box.corner.y = 0.0 box2 = copy.copy(box) lumpy.object_diagram() Figure C.5 shows the result. copy.copy make a shallow copy, so box and box2 have their own width and height, but they share the same embedded Point object. This kind of sharing is usually fine with immutable objects, but with mutable types, it is highly error-prone. C.4 Function and class objects
When I use Lumpy to make object diagrams, I usually define the functions and classes before I make the reference point. That way, function and class objects don’t appear in the diagram. But if you are passing functions and classes as parameters, you might want them to appear. This example shows what that looks like; you can download it from http://thinkpython.com/code/lumpy_demo6.py. import copy
from swampy.Lumpy import Lumpy
lumpy = Lumpy()
lumpy.make_reference()
class Point(object):
"""Represents a point in 2-D space."""
class Rectangle(object):
"""Represents a rectangle."""
def instantiate(constructor):
"""Instantiates a new object."""
obj = constructor()
lumpy.object_diagram()
return obj
point = instantiate(Point)
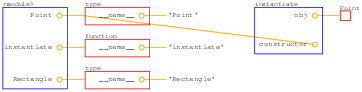
Figure C.6 shows the result. Since we invoke
At the module level, Point and Rectangle refer to class objects (which have type type); instantiate refers to a function object. This diagram might clarify two points of common confusion: (1) the difference between the class object, Point, and the instance of Point, obj, and (2) the difference between the function object created when instantiate is defined, and the frame created with it is called. C.5 Class Diagrams
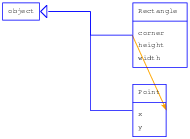
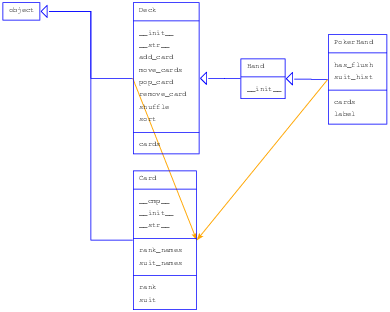
Although I distinguish between state diagrams, stack diagrams and object diagrams, they are mostly the same thing: they show the state of a running program at a point in time. Class diagrams are different. They show the classes that make up a program and the relationships between them. They are timeless in the sense that they describe the program as a whole, not any particular point in time. For example, if an instance of Class A generally contains a reference to an instance of Class B, we say there is a “HAS-A relationship” between those classes. Here’s an example that shows a HAS-A relationship. You can download it from http://thinkpython.com/code/lumpy_demo7.py. from swampy.Lumpy import Lumpy lumpy = Lumpy() lumpy.make_reference() box = Rectangle() box.width = 100.0 box.height = 200.0 box.corner = Point() box.corner.x = 0.0 box.corner.y = 0.0 lumpy.class_diagram() Figure C.7 shows the result. Each class is represented with a box that contains the name of the class, any methods the class provides, any class variables, and any instance variables. In this example, Rectangle and Point have instance variables, but no methods or class variables. The arrow from Rectangle to Point shows that Rectangles contain an embedded Point. In addition, Rectangle and Point both inherit from object, which is represented in the diagram with a triangle-headed arrow. Here’s a more complex example using my solution to Exercise 6. You can download the code from http://thinkpython.com/code/lumpy_demo8.py; you will also need http://thinkpython.com/code/PokerHand.py. from swampy.Lumpy import Lumpy from PokerHand import * lumpy = Lumpy() lumpy.make_reference() deck = Deck() hand = PokerHand() deck.move_cards(hand, 7) lumpy.class_diagram() Figure C.8 shows the result. PokerHand inherits from Hand, which inherits from Deck. Both Deck and PokerHand have Cards. This diagram does not show that Hand also has cards, because in the program there are no instances of Hand. This example demonstrates a limitation of Lumpy; it only knows about the attributes and HAS-A relationships of objects that are instantiated. |
ContributeIf you would like to make a contribution to support my books, you can use the button below. Thank you!
Are you using one of our books in a class?We'd like to know about it. Please consider filling out this short survey.
|