


This HTML version of
You might prefer to read the PDF version, or you can buy a hard copy from Amazon.
Chapter 4 More Estimation
4.1 The Euro problem
In Information Theory, Inference, and Learning Algorithms, David MacKay poses this problem:
A statistical statement appeared in “The Guardian" on Friday January 4, 2002:When spun on edge 250 times, a Belgian one-euro coin came up heads 140 times and tails 110. ‘It looks very suspicious to me,’ said Barry Blight, a statistics lecturer at the London School of Economics. ‘If the coin were unbiased, the chance of getting a result as extreme as that would be less than 7%.’But do these data give evidence that the coin is biased rather than fair?
To answer that question, we’ll proceed in two steps. The first is to estimate the probability that the coin lands face up. The second is to evaluate whether the data support the hypothesis that the coin is biased.
You can download the code in this section from http://thinkbayes.com/euro.py. For more information see Section 0.3.
Any given coin has some probability, x, of landing heads up when spun on edge. It seems reasonable to believe that the value of x depends on some physical characteristics of the coin, primarily the distribution of weight.
If a coin is perfectly balanced, we expect x to be close to 50%, but for a lopsided coin, x might be substantially different. We can use Bayes’s theorem and the observed data to estimate x.
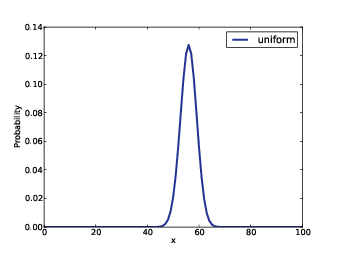
Let’s define 101 hypotheses, where Hx is the hypothesis that the probability of heads is x%, for values from 0 to 100. I’ll start with a uniform prior where the probability of Hx is the same for all x. We’ll come back later to consider other priors.
Figure 4.1: Posterior distribution for the Euro problem on a uniform prior.
The likelihood function is relatively easy: If Hx is true, the probability of heads is x/100 and the probability of tails is 1− x/100.
class Euro(Suite):

    def Likelihood(self, data, hypo):
        x = hypo
        if data == 'H':
            return x/100.0
        else:
            return 1 - x/100.0
Here’s the code that makes the suite and updates it:
    suite = Euro(xrange(0, 101))
    dataset = 'H' * 140 + 'T' * 110

    for data in dataset:
        suite.Update(data)
The result is in Figure 4.1.
4.2 Summarizing the posterior
Again, there are several ways to summarize the posterior distribution.
One option is to find the most likely value in the posterior
distribution. thinkbayes provides a function that does
that:
def MaximumLikelihood(pmf):
    """Returns the value with the highest probability."""
    prob, val = max((prob, val) for val, prob in pmf.Items())
    return val
In this case the result is 56, which is also the observed percentage of heads, 140/250 = 56%. So that suggests (correctly) that the observed percentage is the maximum likelihood estimator for the population.
We might also summarize the posterior by computing the mean and median:
    print 'Mean', suite.Mean()
    print 'Median', thinkbayes.Percentile(suite, 50)
The mean is 55.95; the median is 56. Finally, we can compute a credible interval:
print 'CI', thinkbayes.CredibleInterval(suite, 90)
The result is (51, 61).
Now, getting back to the original question, we would like to know whether the coin is fair. We observe that the posterior credible interval does not include 50%, which suggests that the coin is not fair.
But that is not exactly the question we started with. MacKay asked, “ Do these data give evidence that the coin is biased rather than fair?” To answer that question, we will have to be more precise about what it means to say that data constitute evidence for a hypothesis. And that is the subject of the next chapter.
But before we go on, I want to address one possible source of confusion. Since we want to know whether the coin is fair, it might be tempting to ask for the probability that x is 50%:
print suite.Prob(50)
The result is 0.021, but that value is almost meaningless. The decision to evaluate 101 hypotheses was arbitrary; we could have divided the range into more or fewer pieces, and if we had, the probability for any given hypothesis would be greater or less.
4.3 Swamping the priors
Figure 4.2: Uniform and triangular priors for the Euro problem.
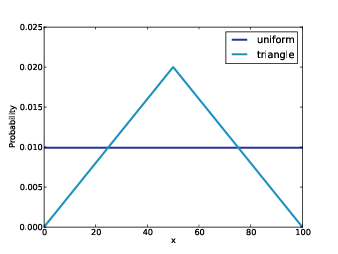
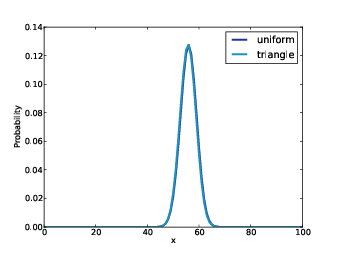
Figure 4.3: Posterior distributions for the Euro problem.
We started with a uniform prior, but that might not be a good choice. I can believe that if a coin is lopsided, x might deviate substantially from 50%, but it seems unlikely that the Belgian Euro coin is so imbalanced that x is 10% or 90%.
It might be more reasonable to choose a prior that gives higher probability to values of x near 50% and lower probability to extreme values.
As an example, I constructed a triangular prior, shown in Figure 4.2. Here’s the code that constructs the prior:
def TrianglePrior():
    suite = Euro()
    for x in range(0, 51):
        suite.Set(x, x)
    for x in range(51, 101):
        suite.Set(x, 100-x)
    suite.Normalize()
Figure 4.2 shows the result (and the uniform prior for comparison). Updating this prior with the same dataset yields the posterior distribution shown in Figure 4.3. Even with substantially different priors, the posterior distributions are very similar. The medians and the credible intervals are identical; the means differ by less than 0.5%.
This is an example of swamping the priors: with enough data, people who start with different priors will tend to converge on the same posterior.
4.4 Optimization
The code I have shown so far is meant to be easy to read, but it is not very efficient. In general, I like to develop code that is demonstrably correct, then check whether it is fast enough for my purposes. If so, there is no need to optimize. For this example, if we care about run time, there are several ways we can speed it up.
The first opportunity is to reduce the number of times we
normalize the suite.
In the original code, we call Update once for each spin.
    dataset = 'H' * heads + 'T' * tails

    for data in dataset:
        suite.Update(data)
And here’s what Update looks like:
    def Update(self, data):
        for hypo in self.Values():
            like = self.Likelihood(data, hypo)
            self.Mult(hypo, like)
        return self.Normalize()
Each update iterates through the hypotheses, then calls Normalize,
which iterates through the hypotheses again. We can save some
time by doing all of the updates before normalizing.
Suite provides a method called UpdateSet that does
exactly that. Here it is:
    def UpdateSet(self, dataset):
        for data in dataset:
            for hypo in self.Values():
                like = self.Likelihood(data, hypo)
                self.Mult(hypo, like)
        return self.Normalize()
And here’s how we can invoke it:
    dataset = 'H' * heads + 'T' * tails
    suite.UpdateSet(dataset)
This optimization speeds things up, but the run time is still
proportional to the amount of data. We can speed things up
even more by rewriting Likelihood to process the entire
dataset, rather than one spin at a time.
In the original version,
data is a string that encodes either heads or tails:
    def Likelihood(self, data, hypo):
        x = hypo / 100.0
        if data == 'H':
            return x
        else:
            return 1-x
As an alternative, we could encode the dataset as a tuple of
two integers: the number of heads and tails.
In that case Likelihood looks like this:
    def Likelihood(self, data, hypo):
        x = hypo / 100.0
        heads, tails = data
        like = x**heads * (1-x)**tails
        return like
And then we can call Update like this:
    heads, tails = 140, 110
    suite.Update((heads, tails))
Since we have replaced repeated multiplication with exponentiation, this version takes the same time for any number of spins.
4.5 The beta distribution
There is one more optimization that solves this problem even faster.
So far we have used a Pmf object to represent a discrete set of values for x. Now we will use a continuous distribution, specifically the beta distribution (see http://en.wikipedia.org/wiki/Beta_distribution).
The beta distribution is defined on the interval from 0 to 1 (including both), so it is a natural choice for describing proportions and probabilities. But wait, it gets better.
It turns out that if you do a Bayesian update with a binomial likelihood function, which is what we did in the previous section, the beta distribution is a conjugate prior. That means that if the prior distribution for x is a beta distribution, the posterior is also a beta distribution. But wait, it gets even better.
The shape of the beta distribution depends on two parameters, written α and β, or alpha and beta. If the prior is a beta distribution with parameters alpha and beta, and we see data with h heads and t tails, the posterior is a beta distribution with parameters alpha+h and beta+t. In other words, we can do an update with two additions.
So that’s great, but it only works if we can find a beta distribution that is a good choice for a prior. Fortunately, for many realistic priors there is a beta distribution that is at least a good approximation, and for a uniform prior there is a perfect match. The beta distribution with alpha=1 and beta=1 is uniform from 0 to 1.
Let’s see how we can take advantage of all this. thinkbayes.py provides a class that represents a beta distribution:
class Beta(object):

    def __init__(self, alpha=1, beta=1):
        self.alpha = alpha
        self.beta = beta
By default __init__ makes a uniform distribution.
Update performs a Bayesian update:
    def Update(self, data):
        heads, tails = data
        self.alpha += heads
        self.beta += tails
data is a pair of integers representing the number of heads and tails.
So we have yet another way to solve the Euro problem:
    beta = thinkbayes.Beta()
    beta.Update((140, 110))
    print beta.Mean()
Beta provides Mean, which computes a simple function of alpha and beta:
    def Mean(self):
        return float(self.alpha) / (self.alpha + self.beta)
For the Euro problem the posterior mean is 56%, which is the same result we got using Pmfs.
Beta also provides EvalPdf, which evaluates the probability density function (PDF) of the beta distribution:
    def EvalPdf(self, x):
        return x**(self.alpha-1) * (1-x)**(self.beta-1)
Finally, Beta provides MakePmf, which uses EvalPdf to generate a discrete approximation of the beta distribution.
4.6 Discussion
In this chapter we solved the same problem with two different priors and found that with a large dataset, the priors get swamped. If two people start with different prior beliefs, they generally find, as they see more data, that their posterior distributions converge. At some point the difference between their distributions is small enough that it has no practical effect.
When this happens, it relieves some of the worry about objectivity that I discussed in the previous chapter. And for many real-world problems even stark prior beliefs can eventually be reconciled by data.
But that is not always the case. First, remember that all Bayesian analysis is based on modeling decisions. If you and I do not choose the same model, we might interpret data differently. So even with the same data, we would compute different likelihoods, and our posterior beliefs might not converge.
Also, notice that in a Bayesian update, we multiply each prior probability by a likelihood, so if p(H) is 0, p(H|D) is also 0, regardless of D. In the Euro problem, if you are convinced that x is less than 50%, and you assign probability 0 to all other hypotheses, no amount of data will convince you otherwise.
This observation is the basis of Cromwell’s rule, which is the recommendation that you should avoid giving a prior probability of 0 to any hypothesis that is even remotely possible (see http://en.wikipedia.org/wiki/Cromwell's_rule).
Cromwell’s rule is named after Oliver Cromwell, who wrote, “I beseech you, in the bowels of Christ, think it possible that you may be mistaken.” For Bayesians, this turns out to be good advice (even if it’s a little overwrought).
4.7 Exercises
Suppose that instead of observing coin tosses directly, you measure the outcome using an instrument that is not always correct. Specifically, suppose there is a probability y that an actual heads is reported as tails, or actual tails reported as heads.
Write a class that estimates the bias of a coin given a series of outcomes and the value of y.
How does the spread of the posterior distribution depend on y?
This exercise is inspired by a question posted by a “redditor” named dominosci on Reddit’s statistics “subreddit” at http://reddit.com/r/statistics.
Reddit is an online forum with many interest groups called subreddits. Users, called redditors, post links to online content and other web pages. Other redditors vote on the links, giving an “upvote” to high-quality links and a “downvote” to links that are bad or irrelevant.
A problem, identified by dominosci, is that some redditors are more reliable than others, and Reddit does not take this into account.
The challenge is to devise a system so that when a redditor casts a vote, the estimated quality of the link is updated in accordance with the reliability of the redditor, and the estimated reliability of the redditor is updated in accordance with the quality of the link.
One approach is to model the quality of the link as the probability of garnering an upvote, and to model the reliability of the redditor as the probability of correctly giving an upvote to a high-quality item.
Write class definitions for redditors and links and an update function that updates both objects whenever a redditor casts a vote.


