


This HTML version of
You might prefer to read the PDF version, or you can buy a hard copy from Amazon.
Chapter 5 Odds and Addends
5.1 Odds
One way to represent a probability is with a number between 0 and 1, but that’s not the only way. If you have ever bet on a football game or a horse race, you have probably encountered another representation of probability, called odds.
You might have heard expressions like “the odds are three to one,” but you might not know what that means. The odds in favor of an event are the ratio of the probability it will occur to the probability that it will not.
So if I think my team has a 75% chance of winning, I would say that the odds in their favor are three to one, because the chance of winning is three times the chance of losing.
You can write odds in decimal form, but it is most common to write them as a ratio of integers. So “three to one” is written 3:1.
When probabilities are low, it is more common to report the odds against rather than the odds in favor. For example, if I think my horse has a 10% chance of winning, I would say that the odds against are 9:1.
Probabilities and odds are different representations of the same information. Given a probability, you can compute the odds like this:
def Odds(p):
    return p / (1-p)
Given the odds in favor, in decimal form, you can convert to probability like this:
def Probability(o):
    return o / (o+1)
If you represent odds with a numerator and denominator, you can convert to probability like this:
def Probability2(yes, no):
    return yes / (yes + no)
When I work with odds in my head, I find it helpful to picture people at the track. If 20% of them think my horse will win, then 80% of them don’t, so the odds in favor are 20:80 or 1:4.
If the odds are 5:1 against my horse, then five out of six people think she will lose, so the probability of winning is 1/6.
5.2 The odds form of Bayes’s theorem
In Chapter 1 I wrote Bayes’s theorem in the probability form:
| p(H|D) = |
|
If we have two hypotheses, A and B, we can write the ratio of posterior probabilities like this:
| = |
|
Notice that the normalizing constant, p(D), drops out of this equation.
If A and B are mutually exclusive and collectively exhaustive, that means p(B) = 1 − p(A), so we can rewrite the ratio of the priors, and the ratio of the posteriors, as odds.
Writing o(A) for odds in favor of A, we get:
| o(A|D) = o(A) |
|
In words, this says that the posterior odds are the prior odds times the likelihood ratio. This is the odds form of Bayes’s theorem.
This form is most convenient for computing a Bayesian update on paper or in your head. For example, let’s go back to the cookie problem:
Suppose there are two bowls of cookies. Bowl 1 contains 30 vanilla cookies and 10 chocolate cookies. Bowl 2 contains 20 of each.Now suppose you choose one of the bowls at random and, without looking, select a cookie at random. The cookie is vanilla. What is the probability that it came from Bowl 1?
The prior probability is 50%, so the prior odds are 1:1, or just 1. The likelihood ratio is 3/4 / 1/2, or 3/2. So the posterior odds are 3:2, which corresponds to probability 3/5.
5.3 Oliver’s blood
Here is another problem from MacKay’s Information Theory, Inference, and Learning Algorithms:
Two people have left traces of their own blood at the scene of a crime. A suspect, Oliver, is tested and found to have type ‘O’ blood. The blood groups of the two traces are found to be of type ‘O’ (a common type in the local population, having frequency 60%) and of type ‘AB’ (a rare type, with frequency 1%). Do these data [the traces found at the scene] give evidence in favor of the proposition that Oliver was one of the people [who left blood at the scene]?
To answer this question, we need to think about what it means for data to give evidence in favor of (or against) a hypothesis. Intuitively, we might say that data favor a hypothesis if the hypothesis is more likely in light of the data than it was before.
In the cookie problem, the prior odds are 1:1, or probability 50%. The posterior odds are 3:2, or probability 60%. So we could say that the vanilla cookie is evidence in favor of Bowl 1.
The odds form of Bayes’s theorem provides a way to make this intuition more precise. Again
| o(A|D) = o(A) |
|
Or dividing through by o(A):
| = |
|
The term on the left is the ratio of the posterior and prior odds. The term on the right is the likelihood ratio, also called the Bayes factor.
If the Bayes factor value is greater than 1, that means that the data were more likely under A than under B. And since the odds ratio is also greater than 1, that means that the odds are greater, in light of the data, than they were before.
If the Bayes factor is less than 1, that means the data were less likely under A than under B, so the odds in favor of A go down.
Finally, if the Bayes factor is exactly 1, the data are equally likely under either hypothesis, so the odds do not change.
Now we can get back to the Oliver’s blood problem. If Oliver is one of the people who left blood at the crime scene, then he accounts for the ‘O’ sample, so the probability of the data is just the probability that a random member of the population has type ‘AB’ blood, which is 1%.
If Oliver did not leave blood at the scene, then we have two samples to account for. If we choose two random people from the population, what is the chance of finding one with type ‘O’ and one with type ‘AB’? Well, there are two ways it might happen: the first person we choose might have type ‘O’ and the second ‘AB’, or the other way around. So the total probability is 2 (0.6) (0.01) = 1.2%.
The likelihood of the data is slightly higher if Oliver is not one of the people who left blood at the scene, so the blood data is actually evidence against Oliver’s guilt.
This example is a little contrived, but it is an example of the counterintuitive result that data consistent with a hypothesis are not necessarily in favor of the hypothesis.
If this result is so counterintuitive that it bothers you, this way of thinking might help: the data consist of a common event, type ‘O’ blood, and a rare event, type ‘AB’ blood. If Oliver accounts for the common event, that leaves the rare event still unexplained. If Oliver doesn’t account for the ‘O’ blood, then we have two chances to find someone in the population with ‘AB’ blood. And that factor of two makes the difference.
5.4 Addends
The fundamental operation of Bayesian statistics is Update, which takes a prior distribution and a set of data, and produces a posterior distribution. But solving real problems usually involves a number of other operations, including scaling, addition and other arithmetic operations, max and min, and mixtures.
This chapter presents addition and max; I will present other operations as we need them.
The first example is based on Dungeons & Dragons, a role-playing game where the results of players’ decisions are usually determined by rolling dice. In fact, before game play starts, players generate each attribute of their characters—strength, intelligence, wisdom, dexterity, constitution, and charisma—by rolling three 6-sided dice and adding them up.
So you might be curious to know the distribution of this sum. There are two ways you might compute it:
- Simulation:
- Given a Pmf that represents the distribution for a single die, you can draw random samples, add them up, and accumulate the distribution of simulated sums.
- Enumeration:
- Given two Pmfs, you can enumerate all possible pairs of values and compute the distribution of the sums.
thinkbayes provides functions for both. Here’s an example
of the first approach. First, I’ll define a class to represent
a single die as a Pmf:
class Die(thinkbayes.Pmf):

    def __init__(self, sides):
        thinkbayes.Pmf.__init__(self)
        for x in xrange(1, sides+1):
            self.Set(x, 1)
        self.Normalize()
Now I can create a 6-sided die:
d6 = Die(6)
And use thinkbayes.SampleSum to generate a sample of 1000 rolls.
dice = [d6] * 3
three = thinkbayes.SampleSum(dice, 1000)
SampleSum takes list of distributions (either Pmf or Cdf
objects) and the sample size, n. It generates n random
sums and returns their distribution as a Pmf object.
def SampleSum(dists, n):
    pmf = MakePmfFromList(RandomSum(dists) for i in xrange(n))
    return pmf
SampleSum uses RandomSum, also in thinkbayes.py:
def RandomSum(dists):
    total = sum(dist.Random() for dist in dists)
    return total
RandomSum invokes Random on each distribution and adds up the results.
The drawback of simulation is that the result
is only approximately correct. As n gets larger, it gets
more accurate, but of course the run time increases as well.
The other approach is to enumerate all pairs of values and
compute the sum and probability of each pair. This is implemented
in Pmf.__add__:
# class Pmf

    def __add__(self, other):
        pmf = Pmf()
        for v1, p1 in self.Items():
            for v2, p2 in other.Items():
                pmf.Incr(v1+v2, p1*p2)
        return pmf
self is a Pmf, of course; other can be a Pmf or anything
else that provides Items. The result is a new Pmf. The time to
run __add__ depends on the number of items in self and
other; it is proportional to len(self) * len(other).
And here’s how it’s used:
three_exact = d6 + d6 + d6
When you apply the + operator to a Pmf, Python invokes
__add__. In this example, __add__ is invoked twice.
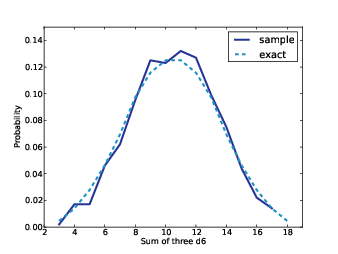
Figure 5.1 shows an approximate result generated by simulation and the exact result computed by enumeration.
Figure 5.1: Approximate and exact distributions for the sum of three 6-sided dice.
Pmf.__add__ is based on the assumption that the random
selections from each Pmf are independent. In the example of rolling
several dice, this assumption is pretty good. In other cases, we
would have to extend this method to use conditional probabilities.
The code from this section is available from http://thinkbayes.com/dungeons.py. For more information see Section 0.3.
5.5 Maxima
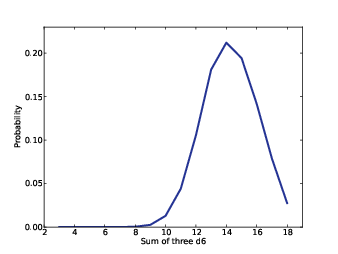
Figure 5.2: Distribution of the maximum of six rolls of three dice.
When you generate a Dungeons & Dragons character, you are particularly interested in the character’s best attributes, so you might like to know the distribution of the maximum attribute.
There are three ways to compute the distribution of a maximum:
- Simulation:
- Given a Pmf that represents the distribution for a single selection, you can generate random samples, find the maximum, and accumulate the distribution of simulated maxima.
- Enumeration:
- Given two Pmfs, you can enumerate all possible pairs of values and compute the distribution of the maximum.
- Exponentiation:
- If we convert a Pmf to a Cdf, there is a simple and efficient algorithm for finding the Cdf of the maximum.
The code to simulate maxima is almost identical to the code for simulating sums:
def RandomMax(dists):
    total = max(dist.Random() for dist in dists)
    return total

def SampleMax(dists, n):
    pmf = MakePmfFromList(RandomMax(dists) for i in xrange(n))
    return pmf
All I did was replace “sum” with “max”. And the code for enumeration is almost identical, too:
def PmfMax(pmf1, pmf2):
    res = thinkbayes.Pmf()
    for v1, p1 in pmf1.Items():
        for v2, p2 in pmf2.Items():
            res.Incr(max(v1, v2), p1*p2)
    return res
In fact, you could generalize this function by taking the appropriate operator as a parameter.
The only problem with this algorithm is that if each Pmf has m values, the run time is proportional to m2. And if we want the maximum of k selections, it takes time proportional to k m2.
If we convert the Pmfs to Cdfs, we can do the same calculation much faster! The key is to remember the definition of the cumulative distribution function:
| CDF(x) = p(X ≤ x) |
where X is a random variable that means “a value chosen randomly from this distribution.” So, for example, CDF(5) is the probability that a value from this distribution is less than or equal to 5.
If I draw X from CDF1 and Y from CDF2, and compute the maximum Z = max(X, Y), what is the chance that Z is less than or equal to 5? Well, in that case both X and Y must be less than or equal to 5.
If the selections of X and Y are independent,
| CDF3(5) = CDF1(5) CDF2(5) |
where CDF3 is the distribution of Z. I chose the value 5 because I think it makes the formulas easy to read, but we can generalize for any value of z:
| CDF3(z) = CDF1(z) CDF2(z) |
In the special case where we draw k values from the same distribution,
| CDFk(z) = CDF1(z)k |
So to find the distribution of the maximum of k values,
we can enumerate the probabilities in the given Cdf
and raise them to the kth power.
Cdf provides a method that does just that:
# class Cdf

    def Max(self, k):
        cdf = self.Copy()
        cdf.ps = [p**k for p in cdf.ps]
        return cdf
Max takes the number of selections, k, and returns a new
Cdf that represents the distribution of the maximum of k
selections. The run time for this method is proportional to
m, the number of items in the Cdf.
Pmf.Max does the same thing for Pmfs. It has to do a little
more work to convert the Pmf to a Cdf, so the run time is proportional
to m logm, but that’s still better than quadratic.
Finally, here’s an example that computes the distribution of a character’s best attribute:
    best_attr_cdf = three_exact.Max(6)
    best_attr_pmf = best_attr_cdf.MakePmf()
Where three_exact is defined in the previous section.
If we print the results, we see that the chance of generating
a character with at least one attribute of 18 is about 3%.
Figure 5.2 shows the distribution.
5.6 Mixtures
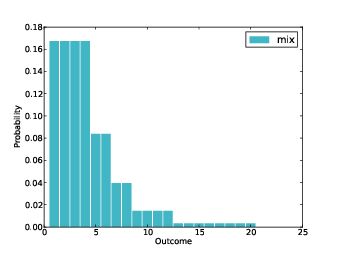
Figure 5.3: Distribution outcome for random die from a box.
Let’s do one more example from Dungeons & Dragons. Suppose I have a box of dice with the following inventory:
5   4-sided dice
4   6-sided dice
3   8-sided dice
2  12-sided dice
1  20-sided die
I choose a die from the box and roll it. What is the distribution of the outcome?
If you know which die it is, the answer is easy. A die with n sides yields a uniform distribution from 1 to n, including both.
But if we don’t know which die it is, the resulting distribution is a mixture of uniform distributions with different bounds. In general, this kind of mixture does not fit any simple mathematical model, but it is straightforward to compute the distribution in the form of a PMF.
As always, one option is to simulate the scenario, generate a random sample, and compute the PMF of the sample. This approach is simple and it generates an approximate solution quickly. But if we want an exact solution, we need a different approach.
Let’s start with a simple version of the problem where there are only two dice, one with 6 sides and one with 8. We can make a Pmf to represent each die:
    d6 = Die(6)
    d8 = Die(8)
Then we create a Pmf to represent the mixture:
    mix = thinkbayes.Pmf()
    for die in [d6, d8]:
        for outcome, prob in die.Items():
            mix.Incr(outcome, prob)
    mix.Normalize()
The first loop enumerates the dice; the second enumerates the outcomes and their probabilities. Inside the loop, Pmf.Incr adds up the contributions from the two distributions.
This code assumes that the two dice are equally likely. More generally, we need to know the probability of each die so we can weight the outcomes accordingly.
First we create a Pmf that maps from each die to the probability it is selected:
    pmf_dice = thinkbayes.Pmf()
    pmf_dice.Set(Die(4), 5)
    pmf_dice.Set(Die(6), 4)
    pmf_dice.Set(Die(8), 3)
    pmf_dice.Set(Die(12), 2)
    pmf_dice.Set(Die(20), 1)
    pmf_dice.Normalize()
Next we need a more general version of the mixture algorithm:
    mix = thinkbayes.Pmf()
    for die, weight in pmf_dice.Items():
        for outcome, prob in die.Items():
            mix.Incr(outcome, weight*prob)
Now each die has a weight associated with it (which makes it a weighted die, I suppose). When we add each outcome to the mixture, its probability is multiplied by weight.
Figure 5.3 shows the result. As expected, values 1 through 4 are the most likely because any die can produce them. Values above 12 are unlikely because there is only one die in the box that can produce them (and it does so less than half the time).
thinkbayes provides a function named MakeMixture that encapsulates this algorithm, so we could have written:
mix = thinkbayes.MakeMixture(pmf_dice)
We’ll use MakeMixture again in Chapters 7 and 8.
5.7 Discussion
Other than the odds form of Bayes’s theorem, this chapter is not specifically Bayesian. But Bayesian analysis is all about distributions, so it is important to understand the concept of a distribution well. From a computational point of view, a distribution is any data structure that represents a set of values (possible outcomes of a random process) and their probabilities.
We have seen two representations of distributions: Pmfs and Cdfs. These representations are equivalent in the sense that they contain the same information, so you can convert from one to the other. The primary difference between them is performance: some operations are faster and easier with a Pmf; others are faster with a Cdf.
The other goal of this chapter is to introduce operations that act on
distributions, like Pmf.__add__, Cdf.Max, and thinkbayes.MakeMixture. We will use these operations later, but I
introduce them now to encourage you to think of a distribution as a
fundamental unit of computation, not just a container for values and
probabilities.


