


This HTML version of
You might prefer to read the PDF version, or you can buy a hard copy from Amazon.
Chapter 8 Observer Bias
8.1 The Red Line problem
In Massachusetts, the Red Line is a subway that connects Cambridge and Boston. When I was working in Cambridge I took the Red Line from Kendall Square to South Station and caught the commuter rail to Needham. During rush hour Red Line trains run every 7–8 minutes, on average.
When I arrived at the station, I could estimate the time until the next train based on the number of passengers on the platform. If there were only a few people, I inferred that I just missed a train and expected to wait about 7 minutes. If there were more passengers, I expected the train to arrive sooner. But if there were a large number of passengers, I suspected that trains were not running on schedule, so I would go back to the street level and get a taxi.
While I was waiting for trains, I thought about how Bayesian estimation could help predict my wait time and decide when I should give up and take a taxi. This chapter presents the analysis I came up with.
This chapter is based on a project by Brendan Ritter and Kai Austin, who took a class with me at Olin College. The code in this chapter is available from http://thinkbayes.com/redline.py. The code I used to collect data is in http://thinkbayes.com/redline_data.py. For more information see Section 0.3.
8.2 The model
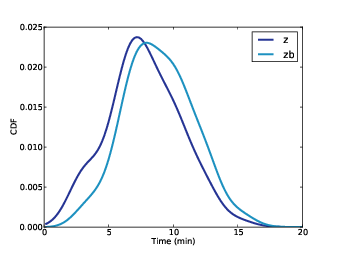
Figure 8.1: PMF of gaps between trains, based on collected data, smoothed by KDE. z is the actual distribution; zb is the biased distribution seen by passengers.
Before we get to the analysis, we have to make some modeling decisions. First, I will treat passenger arrivals as a Poisson process, which means I assume that passengers are equally likely to arrive at any time, and that they arrive at an unknown rate, λ, measured in passengers per minute. Since I observe passengers during a short period of time, and at the same time every day, I assume that λ is constant.
On the other hand, the arrival process for trains is not Poisson. Trains to Boston are supposed to leave from the end of the line (Alewife station) every 7–8 minutes during peak times, but by the time they get to Kendall Square, the time between trains varies between 3 and 12 minutes.
To gather data on the time between trains, I wrote a script that downloads real-time data from http://www.mbta.com/rider_tools/developers/, selects south-bound trains arriving at Kendall square, and records their arrival times in a database. I ran the script from 4pm to 6pm every weekday for 5 days, and recorded about 15 arrivals per day. Then I computed the time between consecutive arrivals; the distribution of these gaps is shown in Figure 8.1, labeled z.
If you stood on the platform from 4pm to 6pm and recorded the time between trains, this is the distribution you would see. But if you arrive at some random time (without regard to the train schedule) you would see a different distribution. The average time between trains, as seen by a random passenger, is substantially higher than the true average.
Why? Because a passenger is more like to arrive during a large interval than a small one. Consider a simple example: suppose that the time between trains is either 5 minutes or 10 minutes with equal probability. In that case the average time between trains is 7.5 minutes.
But a passenger is more likely to arrive during a 10 minute gap than a 5 minute gap; in fact, twice as likely. If we surveyed arriving passengers, we would find that 2/3 of them arrived during a 10 minute gap, and only 1/3 during a 5 minute gap. So the average time between trains, as seen by an arriving passenger, is 8.33 minutes.
This kind of observer bias appears in many contexts. Students think that classes are bigger than they are because more of them are in the big classes. Airline passengers think that planes are fuller than they are because more of them are on full flights.
In each case, values from the actual distribution are oversampled in proportion to their value. In the Red Line example, a gap that is twice as big is twice as likely to be observed.
So given the actual distribution of gaps, we can compute the distribution of gaps as seen by passengers. BiasPmf does this computation:
def BiasPmf(pmf):
    new_pmf = pmf.Copy()

    for x, p in pmf.Items():
        new_pmf.Mult(x, x)

    new_pmf.Normalize()
    return new_pmf
pmf is the actual distribution; new_pmf is the
biased distribution. Inside the loop, we multiply the
probability of each value, x, by the likelihood it will
be observed, which is proportional to x. Then we
normalize the result.
Figure 8.1 shows the actual distribution of gaps, labeled z, and the distribution of gaps seen by passengers, labeled zb for “z biased”.
8.3 Wait times
Figure 8.2: CDF of z, zb, and the wait time seen by passengers, y.
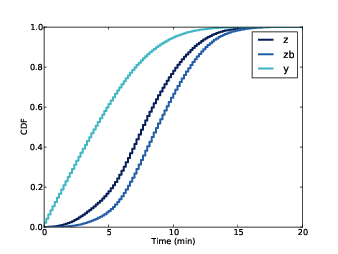
Wait time, which I call y, is the time between the arrival of a passenger and the next arrival of a train. Elapsed time, which I call x, is the time between the arrival of the previous train and the arrival of a passenger. I chose these definitions so that zb = x + y.
Given the distribution of zb, we can compute the distribution of y. I’ll start with a simple case and then generalize. Suppose, as in the previous example, that zb is either 5 minutes with probability 1/3, or 10 minutes with probability 2/3.
If we arrive at a random time during a 5 minute gap, y is uniform from 0 to 5 minutes. If we arrive during a 10 minute gap, y is uniform from 0 to 10. So the overall distribution is a mixture of uniform distributions weighted according to the probability of each gap.
The following function takes the distribution of zb and computes the distribution of y:
def PmfOfWaitTime(pmf_zb):
    metapmf = thinkbayes.Pmf()
    for gap, prob in pmf_zb.Items():
        uniform = MakeUniformPmf(0, gap)
        metapmf.Set(uniform, prob)

    pmf_y = thinkbayes.MakeMixture(metapmf)
    return pmf_y
PmfOfWaitTime makes a meta-Pmf that maps from each uniform distribution to its probability. Then it uses MakeMixture, which we saw in Section 5.6, to compute the mixture.
PmfOfWaitTime also uses MakeUniformPmf, defined here:
def MakeUniformPmf(low, high):
    pmf = thinkbayes.Pmf()
    for x in MakeRange(low=low, high=high):
        pmf.Set(x, 1)
    pmf.Normalize()
    return pmf
low and high are the range of the uniform distribution, (both ends included). Finally, MakeUniformPmf uses MakeRange, defined here:
def MakeRange(low, high, skip=10):
    return range(low, high+skip, skip)
MakeRange defines a set of possible values for wait time (expressed in seconds). By default it divides the range into 10 second intervals.
To encapsulate the process of computing these distributions, I created a class called WaitTimeCalculator:
class WaitTimeCalculator(object):

    def __init__(self, pmf_z):
        self.pmf_z = pmf_z
        self.pmf_zb = BiasPmf(pmf)

        self.pmf_y = self.PmfOfWaitTime(self.pmf_zb)
        self.pmf_x = self.pmf_y
The parameter, pmf_z, is the unbiased distribution of z.
pmf_zb is the biased distribution of gap time, as seen by
passengers.
pmf_y is the distribution of wait time. pmf_x is the
distribution of elapsed time, which is the same as the distribution of
wait time. To see why, remember that for a particular value of
zp, the distribution of y is uniform from 0 to zp.
Also
x = zp - y
So the distribution of x is also uniform from 0 to zp.
Figure 8.2 shows the distribution of z, zb, and y based on the data I collected from the Red Line web site.
To present these distributions, I am switching from Pmfs to Cdfs. Most people are more familiar with Pmfs, but I think Cdfs are easier to interpret, once you get used to them. And if you want to plot several distributions on the same axes, Cdfs are the way to go.
The mean of z is 7.8 minutes. The mean of zb is 8.8 minutes, about 13% higher. The mean of y is 4.4, half the mean of zb.
As an aside, the Red Line schedule reports that trains run every 9 minutes during peak times. This is close to the average of zb, but higher than the average of z. I exchanged email with a representative of the MBTA, who confirmed that the reported time between trains is deliberately conservative in order to account for variability.
8.4 Predicting wait times
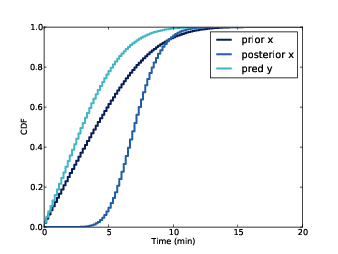
Figure 8.3: Prior and posterior of x and predicted y.
Let’s get back to the motivating question: suppose that when I arrive at the platform I see 10 people waiting. How long should I expect to wait until the next train arrives?
As always, let’s start with the easiest version of the problem and work our way up. Suppose we are given the actual distribution of z, and we know that the passenger arrival rate, λ, is 2 passengers per minute.
In that case we can:
- Use the distribution of z to compute the prior distribution of zp, the time between trains as seen by a passenger.
- Then we can use the number of passengers to estimate the distribution of x, the elapsed time since the last train.
- Finally, we use the relation y = zp - x to get the distribution of y.
The first step is to create a WaitTimeCalculator that encapsulates the distributions of zp, x, and y, prior to taking into account the number of passengers.
wtc = WaitTimeCalculator(pmf_z)
pmf_z is the given distribution of gap times.
The next step is to make an ElapsedTimeEstimator (defined below), which encapsulates the posterior distribution of x and the predictive distribution of y.
    ete = ElapsedTimeEstimator(wtc,
                               lam=2.0/60,
                               num_passengers=15)
The parameters are the WaitTimeCalculator, the passenger arrival rate, lam (expressed in passengers per second), and the observed number of passengers, let’s say 15.
Here is the definition of ElapsedTimeEstimator:
class ElapsedTimeEstimator(object):

    def __init__(self, wtc, lam, num_passengers):
        self.prior_x = Elapsed(wtc.pmf_x)

        self.post_x = self.prior_x.Copy()
        self.post_x.Update((lam, num_passengers))

        self.pmf_y = PredictWaitTime(wtc.pmf_zb, self.post_x)
prior_x and posterior_x are the prior and
posterior distributions of elapsed time. pmf_y is
the predictive distribution of wait time.
ElapsedTimeEstimator uses Elapsed and PredictWaitTime, defined below.
Elapsed is a Suite that represents the hypothetical distribution of x. The prior distribution of x comes straight from the WaitTimeCalculator. Then we use the data, which consists of the arrival rate, lam, and the number of passengers on the platform, to compute the posterior distribution.
Here’s the definition of Elapsed:
class Elapsed(thinkbayes.Suite):

    def Likelihood(self, data, hypo):
        x = hypo
        lam, k = data
        like = thinkbayes.EvalPoissonPmf(k, lam * x)
        return like
As always, Likelihood takes a hypothesis and data, and computes the likelihood of the data under the hypothesis. In this case hypo is the elapsed time since the last train and data is a tuple of lam and the number of passengers.
The likelihood of the data is the probability of getting k arrivals in x time, given arrival rate lam. We compute that using the PMF of the Poisson distribution.
Finally, here’s the definition of PredictWaitTime:
def PredictWaitTime(pmf_zb, pmf_x):
    pmf_y = pmf_zb - pmf_x
    RemoveNegatives(pmf_y)
    return pmf_y
pmf_zb is the distribution of gaps between trains;
pmf_x is the distribution of elapsed time, based on
the observed number of passengers. Since y = zb - x,
we can compute
pmf_y = pmf_zb - pmf_x
The subtraction operator invokes Pmf.__sub__, which enumerates
all pairs of zb and x, computes the differences, and adds
the results to pmf_y.
The resulting Pmf includes some negative values, which we know are impossible. For example, if you arrive during a gap of 5 minutes, you can’t wait more than 5 minutes. RemoveNegatives removes the impossible values from the distribution and renormalizes.
def RemoveNegatives(pmf):
    for val in pmf.Values():
        if val < 0:
            pmf.Remove(val)
    pmf.Normalize()
Figure 8.3 shows the results. The prior distribution of x is the same as the distribution of y in Figure 8.2. The posterior distribution of x shows that, after seeing 15 passengers on the platform, we believe that the time since the last train is probably 5-10 minutes. The predictive distribution of y indicates that we expect the next train in less than 5 minutes, with about 80% confidence.
8.5 Estimating the arrival rate
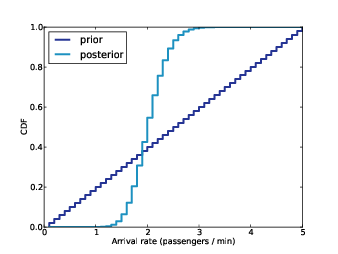
Figure 8.4: Prior and posterior distributions of lam based on five days of passenger data.
The analysis so far has been based on the assumption that we know (1) the distribution of gaps and (2) the passenger arrival rate. Now we are ready to relax the second assumption.
Suppose that you just moved to Boston, so you don’t know much about the passenger arrival rate on the Red Line. After a few days of commuting, you could make a guess, at least qualitatively. With a little more effort, you could estimate λ quantitatively.
Each day when you arrive at the platform, you should note the time and the number of passengers waiting (if the platform is too big, you could choose a sample area). Then you should record your wait time and the number of new arrivals while you are waiting.
After five days, you might have data like this:
k1      y     k2
--     ---    --
17     4.6     9
22     1.0     0
23     1.4     4
18     5.4    12
4      5.8    11
where k1 is the number of passengers waiting when you arrive, y is your wait time in minutes, and k2 is the number of passengers who arrive while you are waiting.
Over the course of one week, you waited 18 minutes and saw 36 passengers arrive, so you would estimate that the arrival rate is 2 passengers per minute. For practical purposes that estimate is good enough, but for the sake of completeness I will compute a posterior distribution for λ and show how to use that distribution in the rest of the analysis.
ArrivalRate is a Suite that represents hypotheses about λ. As always, Likelihood takes a hypothesis and data, and computes the likelihood of the data under the hypothesis.
In this case the hypothesis is a value of λ. The data is a pair, y, k, where y is a wait time and k is the number of passengers that arrived.
class ArrivalRate(thinkbayes.Suite):

    def Likelihood(self, data, hypo):
        lam = hypo
        y, k = data
        like = thinkbayes.EvalPoissonPmf(k, lam * y)
        return like
This Likelihood might look familiar; it is almost identical to Elapsed.Likelihood in Section 8.4. The difference is that in Elapsed.Likelihood the hypothesis is x, the elapsed time; in ArrivalRate.Likelihood the hypothesis is lam, the arrival rate. But in both cases the likelihood is the probability of seeing k arrivals in some period of time, given lam.
ArrivalRateEstimator encapsulates the process of estimating
λ. The parameter, passenger_data, is a list
of k1, y, k2 tuples, as in the table above.
class ArrivalRateEstimator(object):

    def __init__(self, passenger_data):
        low, high = 0, 5
        n = 51
        hypos = numpy.linspace(low, high, n) / 60

        self.prior_lam = ArrivalRate(hypos)

        self.post_lam = self.prior_lam.Copy()
        for k1, y, k2 in passenger_data:
            self.post_lam.Update((y, k2))
__init__ builds
hypos, which is a sequence of hypothetical values for lam,
then builds the prior distribution, prior_lam.
The for loop updates the prior with data, yielding the posterior
distribution, post_lam.
Figure 8.4 shows the prior and posterior distributions. As expected, the mean and median of the posterior are near the observed rate, 2 passengers per minute. But the spread of the posterior distribution captures our uncertainty about λ based on a small sample.
8.6 Incorporating uncertainty
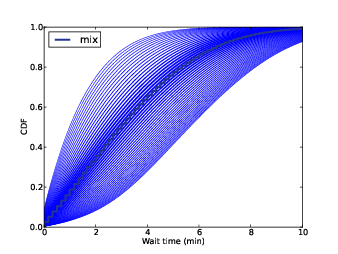
Figure 8.5: Predictive distributions of y for possible values of lam.
Whenever there is uncertainty about one of the inputs to an analysis, we can take it into account by a process like this:
- Implement the analysis based on a deterministic value of the uncertain parameter (in this case λ).
- Compute the distribution of the uncertain parameter.
- Run the analysis for each value of the parameter, and generate a set of predictive distributions.
- Compute a mixture of the predictive distributions, using the weights from the distribution of the parameter.
We have already done steps (1) and (2). I wrote a class called WaitMixtureEstimator to handle steps (3) and (4).
class WaitMixtureEstimator(object):

    def __init__(self, wtc, are, num_passengers=15):
        self.metapmf = thinkbayes.Pmf()

        for lam, prob in sorted(are.post_lam.Items()):
            ete = ElapsedTimeEstimator(wtc, lam, num_passengers)
            self.metapmf.Set(ete.pmf_y, prob)

        self.mixture = thinkbayes.MakeMixture(self.metapmf)
wtc is the WaitTimeCalculator that contains the distribution of zb. are is the ArrivalTimeEstimator that contains the distribution of lam.
The first line makes a meta-Pmf that maps from each possible distribution of y to its probability. For each value of lam, we use ElapsedTimeEstimator to compute the corresponding distribution of y and store it in the Meta-Pmf. Then we use MakeMixture to compute the mixture.
Figure 8.5 shows the results. The shaded lines in the background are the distributions of y for each value of lam, with line thickness that represents likelihood. The dark line is the mixture of these distributions.
In this case we could get a very similar result using a single point estimate of lam. So it was not necessary, for practical purposes, to include the uncertainty of the estimate.
In general, it is important to include variability if the system response is non-linear; that is, if small changes in the input can cause big changes in the output. In this case, posterior variability in lam is small and the system response is approximately linear for small perturbations.
8.7 Decision analysis
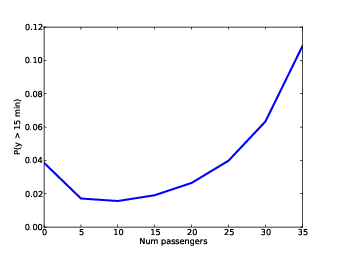
Figure 8.6: Probability that wait time exceeds 15 minutes as a function of the number of passengers on the platform.
At this point we can use the number of passengers on the platform to predict the distribution of wait times. Now let’s get to the second part of the question: when should I stop waiting for the train and go catch a taxi?
Remember that in the original scenario, I am trying to get to South Station to catch the commuter rail. Suppose I leave the office with enough time that I can wait 15 minutes and still make my connection at South Station.
In that case I would like to know the probability that y exceeds
15 minutes as a function of num_passengers. It is easy enough
to use the
analysis from Section 8.4 and run it for a range of
num_passengers.
But there’s a problem. The analysis is sensitive to the frequency of long delays, and because long delays are rare, it is hard to estimate their frequency.
I only have data from one week, and the longest delay I observed was 15 minutes. So I can’t estimate the frequency of longer delays accurately.
However, I can use previous observations to make at least a coarse estimate. When I commuted by Red Line for a year, I saw three long delays caused by a signaling problem, a power outage, and “police activity” at another stop. So I estimate that there are about 3 major delays per year.
But remember that my observations are biased. I am more likely to observe long delays because they affect a large number of passengers. So we should treat my observations as a sample of zb rather than z. Here’s how we can do that.
During my year of commuting, I took the Red Line home about 220
times. So I take the observed gap times, gap_times,
generate a sample of 220 gaps, and compute their Pmf:
    n = 220
    cdf_z = thinkbayes.MakeCdfFromList(gap_times)
    sample_z = cdf_z.Sample(n)
    pmf_z = thinkbayes.MakePmfFromList(sample_z)
Next I bias pmf_z to get the distribution of
zb, draw a sample, and then add in delays of
30, 40, and 50 minutes (expressed in seconds):
    cdf_zp = BiasPmf(pmf_z).MakeCdf()
    sample_zb = cdf_zp.Sample(n) + [1800, 2400, 3000]
Cdf.Sample is more efficient than Pmf.Sample, so it is usually faster to convert a Pmf to a Cdf before sampling.
Next I use the sample of zb to estimate a Pdf using KDE, and then convert the Pdf to a Pmf:
    pdf_zb = thinkbayes.EstimatedPdf(sample_zb)
    xs = MakeRange(low=60)
    pmf_zb = pdf_zb.MakePmf(xs)
Finally I unbias the distribution of zb to get the distribution of z, which I use to create the WaitTimeCalculator:
    pmf_z = UnbiasPmf(pmf_zb)
    wtc = WaitTimeCalculator(pmf_z)
This process is complicated, but all of the steps are operations we have seen before. Now we are ready to compute the probability of a long wait.
def ProbLongWait(num_passengers, minutes):
    ete = ElapsedTimeEstimator(wtc, lam, num_passengers)
    cdf_y = ete.pmf_y.MakeCdf()
    prob = 1 - cdf_y.Prob(minutes * 60)
Given the number of passengers on the platform, ProbLongWait makes an ElapsedTimeEstimator, extracts the distribution of wait time, and computes the probability that wait time exceeds minutes.
Figure 8.6 shows the result. When the number of passengers is less than 20, we infer that the system is operating normally, so the probability of a long delay is small. If there are 30 passengers, we estimate that it has been 15 minutes since the last train; that’s longer than a normal delay, so we infer that something is wrong and expect longer delays.
If we are willing to accept a 10% chance of missing the connection at South Station, we should stay and wait as long as there are fewer than 30 passengers, and take a taxi if there are more.
Or, to take this analysis one step further, we could quantify the cost of missing the connection and the cost of taking a taxi, then choose the threshold that minimizes expected cost.
8.8 Discussion
The analysis so far has been based on the assumption that the arrival rate of passengers is the same every day. For a commuter train during rush hour, that might not be a bad assumption, but there are some obvious exceptions. For example, if there is a special event nearby, a large number of people might arrive at the same time. In that case, the estimate of lam would be too low, so the estimates of x and y would be too high.
If special events are as common as major delays, it would be important to include them in the model. We could do that by extending the distribution of lam to include occasional large values.
We started with the assumption that we know distribution of z. As an alternative, a passenger could estimate z, but it would not be easy. As a passenger, you only observe only your own wait time, y. Unless you skip the first train and wait for the second, you don’t observe the gap between trains, z.
However, we could make some inferences about zb. If we note the number of passengers waiting when we arrive, we can estimate the elapsed time since the last train, x. Then we observe y. If we add the posterior distribution of x to the observed y, we get a distribution that represents our posterior belief about the observed value of zb.
We can use this distribution to update our beliefs about the distribution of zb. Finally, we can compute the inverse of BiasPmf to get from the distribution of zb to the distribution of z.
I leave this analysis as an exercise for the reader. One suggestion: you should read Chapter 15 first. You can find the outline of a solution in http://thinkbayes.com/redline.py. For more information see Section 0.3.
8.9 Exercises
Unstable particles are emitted from a source and decay at a distance x, a real number that has an exponential probability distribution with [parameter] λ. Decay events can only be observed if they occur in a window extending from x=1 cm to x=20 cm. N decays are observed at locations { 1.5, 2, 3, 4, 5, 12 } cm. What is the posterior distribution of λ?
You can download a solution to this exercise from http://thinkbayes.com/decay.py.


