


This HTML version of
You might prefer to read the PDF version, or you can buy a hard copy from Amazon.
Chapter 9 Two Dimensions
9.1 Paintball
Paintball is a sport in which competing teams try to shoot each other with guns that fire paint-filled pellets that break on impact, leaving a colorful mark on the target. It is usually played in an arena decorated with barriers and other objects that can be used as cover.
Suppose you are playing paintball in an indoor arena 30 feet wide and 50 feet long. You are standing near one of the 30 foot walls, and you suspect that one of your opponents has taken cover nearby. Along the wall, you see several paint spatters, all the same color, that you think your opponent fired recently.
The spatters are at 15, 16, 18, and 21 feet, measured from the lower-left corner of the room. Based on these data, where do you think your opponent is hiding?
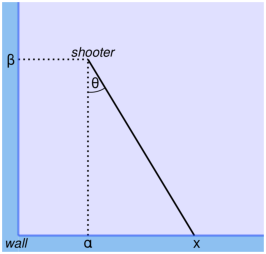
Figure 9.1 shows a diagram of the arena. Using the lower-left corner of the room as the origin, I denote the unknown location of the shooter with coordinates α and β, or alpha and beta. The location of a spatter is labeled x. The angle the opponent shoots at is θ or theta.
The Paintball problem is a modified version of the Lighthouse problem, a common example of Bayesian analysis. My notation follows the presentation of the problem in D.S. Sivia’s, Data Analysis: a Bayesian Tutorial, Second Edition (Oxford, 2006).
You can download the code in this chapter from http://thinkbayes.com/paintball.py. For more information see Section 0.3.
9.2 The suite
Figure 9.1: Diagram of the layout for the paintball problem.
To get started, we need a Suite that represents a set of hypotheses about the location of the opponent. Each hypothesis is a pair of coordinates: (alpha, beta).
Here is the definition of the Paintball suite:
class Paintball(thinkbayes.Suite, thinkbayes.Joint):

    def __init__(self, alphas, betas, locations):
        self.locations = locations
        pairs = [(alpha, beta)
                 for alpha in alphas
                 for beta in betas]
        thinkbayes.Suite.__init__(self, pairs)
Paintball inherits from Suite, which we have seen before, and Joint, which I will explain soon.
alphas is the list of possible values for alpha; betas is the list of values for beta. pairs is a list of all (alpha, beta) pairs.
locations is a list of possible locations along the wall; it is stored for use in Likelihood.
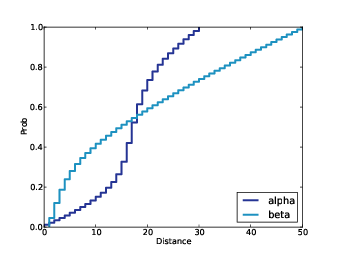
Figure 9.2: Posterior CDFs for alpha and beta, given the data.
The room is 30 feet wide and 50 feet long, so here’s the code that creates the suite:
    alphas = range(0, 31)
    betas = range(1, 51)
    locations = range(0, 31)

    suite = Paintball(alphas, betas, locations)
This prior distribution assumes that all locations in the room are equally likely. Given a map of the room, we might choose a more detailed prior, but we’ll start simple.
9.3 Trigonometry
Now we need a likelihood function, which means we have to figure out the likelihood of hitting any spot along the wall, given the location of the opponent.
As a simple model, imagine that the opponent is like a rotating turret, equally likely to shoot in any direction. In that case, he is most likely to hit the wall at location alpha, and less likely to hit the wall far away from alpha.
With a little trigonometry, we can compute the probability of hitting any spot along the wall. Imagine that the shooter fires a shot at angle θ; the pellet would hit the wall at location x, where
| x − α = β tanθ |
Solving this equation for θ yields
| θ = tan−1 | ⎛ ⎜ ⎜ ⎝ |
| ⎞ ⎟ ⎟ ⎠ |
So given a location on the wall, we can find θ.
Taking the derivative of the first equation with respect to θ yields
| = |
|
This derivative is what I’ll call the “strafing speed”, which is the speed of the target location along the wall as θ increases. The probability of hitting a given point on the wall is inversely related to strafing speed.
If we know the coordinates of the shooter and a location along the wall, we can compute strafing speed:
def StrafingSpeed(alpha, beta, x):
    theta = math.atan2(x - alpha, beta)
    speed = beta / math.cos(theta)**2
    return speed
alpha and beta are the coordinates of the shooter; x is the location of a spatter. The result is the derivative of x with respect to theta.
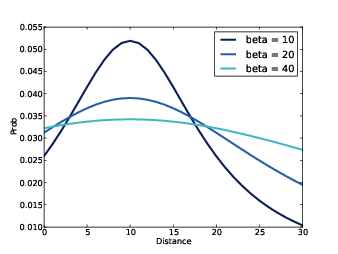
Figure 9.3: PMF of location given alpha=10, for several values of beta.
Now we can compute a Pmf that represents the probability of hitting any location on the wall. MakeLocationPmf takes alpha and beta, the coordinates of the shooter, and locations, a list of possible values of x.
def MakeLocationPmf(alpha, beta, locations):
    pmf = thinkbayes.Pmf()
    for x in locations:
        prob = 1.0 / StrafingSpeed(alpha, beta, x)
        pmf.Set(x, prob)
    pmf.Normalize()
    return pmf
MakeLocationPmf computes the probability of hitting each location, which is inversely related to strafing speed. The result is a Pmf of locations and their probabilities.
Figure 9.3 shows the Pmf of location with alpha = 10 and a range of values for beta. For all values of beta the most likely spatter location is x = 10; as beta increases, so does the spread of the Pmf.
9.4 Likelihood
Now all we need is a likelihood function. We can use MakeLocationPmf to compute the likelihood of any value of x, given the coordinates of the opponent.
    def Likelihood(self, data, hypo):
        alpha, beta = hypo
        x = data
        pmf = MakeLocationPmf(alpha, beta, self.locations)
        like = pmf.Prob(x)
        return like
Again, alpha and beta are the hypothetical coordinates of the shooter, and x is the location of an observed spatter.
pmf contains the probability of each location, given the coordinates of the shooter. From this Pmf, we select the probability of the observed location.
And we’re done. To update the suite, we can use UpdateSet, which is inherited from Suite.
suite.UpdateSet([15, 16, 18, 21])
The result is a distribution that maps each (alpha, beta) pair to a posterior probability.
9.5 Joint distributions
When each value in a distribution is a tuple of variables, it is called a joint distribution because it represents the distributions of the variables together, that is “jointly”. A joint distribution contains the distributions of the variables, as well as information about the relationships among them.
Given a joint distribution, we can compute the distributions of each variable independently, which are called the marginal distributions.
thinkbayes.Joint provides a method that computes marginal distributions:
# class Joint:

    def Marginal(self, i):
        pmf = Pmf()
        for vs, prob in self.Items():
            pmf.Incr(vs[i], prob)
        return pmf
i is the index of the variable we want; in this example i=0 indicates the distribution of alpha, and i=1 indicates the distribution of beta.
Here’s the code that extracts the marginal distributions:
    marginal_alpha = suite.Marginal(0)
    marginal_beta = suite.Marginal(1)
Figure 9.2 shows the results (converted to CDFs). The median value for alpha is 18, near the center of mass of the observed spatters. For beta, the most likely values are close to the wall, but beyond 10 feet the distribution is almost uniform, which indicates that the data do not distinguish strongly between these possible locations.
Given the posterior marginals, we can compute credible intervals for each coordinate independently:
    print 'alpha CI', marginal_alpha.CredibleInterval(50)
    print 'beta CI', marginal_beta.CredibleInterval(50)
The 50% credible intervals are (14, 21) for alpha and (5, 31) for beta. So the data provide evidence that the shooter is in the near side of the room. But it is not strong evidence. The 90% credible intervals cover most of the room!
9.6 Conditional distributions
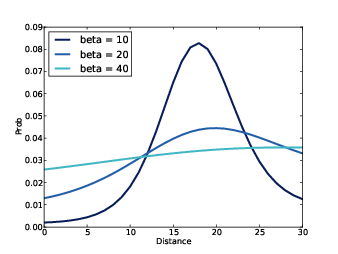
Figure 9.4: Posterior distributions for alpha conditioned on several values of beta.
The marginal distributions contain information about the variables independently, but they do not capture the dependence between variables, if any.
One way to visualize dependence is by computing conditional distributions. thinkbayes.Joint provides a method that does that:
    def Conditional(self, i, j, val):
        pmf = Pmf()
        for vs, prob in self.Items():
            if vs[j] != val: continue
            pmf.Incr(vs[i], prob)

        pmf.Normalize()
        return pmf
Again, i is the index of the variable we want; j is the index of the conditioning variable, and val is the conditional value.
The result is the distribution of the ith variable under the condition that the jth variable is val.
For example, the following code computes the conditional distributions of alpha for a range of values of beta:
    betas = [10, 20, 40]

    for beta in betas:
        cond = suite.Conditional(0, 1, beta)
Figure 9.4 shows the results, which we could fully describe as “posterior conditional marginal distributions.” Whew!
If the variables were independent, the conditional distributions would all be the same. Since they are all different, we can tell the variables are dependent. For example, if we know (somehow) that beta = 10, the conditional distribution of alpha is fairly narrow. For larger values of beta, the distribution of alpha is wider.
9.7 Credible intervals
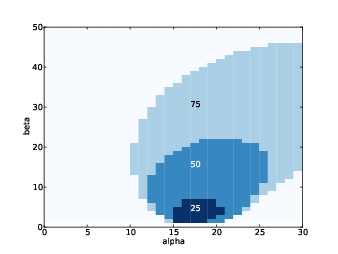
Figure 9.5: Credible intervals for the coordinates of the opponent.
Another way to visualize the posterior joint distribution is to compute credible intervals. When we looked at credible intervals in Section 3.5, I skipped over a subtle point: for a given distribution, there are many intervals with the same level of credibility. For example, if you want a 50% credible interval, you could choose any set of values whose probability adds up to 50%.
When the values are one-dimensional, it is most common to choose the central credible interval; for example, the central 50% credible interval contains all values between the 25th and 75th percentiles.
In multiple dimensions it is less obvious what the right credible interval should be. The best choice might depend on context, but one common choice is the maximum likelihood credible interval, which contains the most likely values that add up to 50% (or some other percentage).
thinkbayes.Joint provides a method that computes maximum likelihood credible intervals.
# class Joint:

    def MaxLikeInterval(self, percentage=90):
        interval = []
        total = 0

        t = [(prob, val) for val, prob in self.Items()]
        t.sort(reverse=True)

        for prob, val in t:
            interval.append(val)
            total += prob
            if total >= percentage/100.0:
                break

        return interval
The first step is to make a list of the values in the suite, sorted in descending order by probability. Next we traverse the list, adding each value to the interval, until the total probability exceeds percentage. The result is a list of values from the suite. Notice that this set of values is not necessarily contiguous.
To visualize the intervals, I wrote a function that “colors” each value according to how many intervals it appears in:
def MakeCrediblePlot(suite):
    d = dict((pair, 0) for pair in suite.Values())

    percentages = [75, 50, 25]
    for p in percentages:
        interval = suite.MaxLikeInterval(p)
        for pair in interval:
            d[pair] += 1

    return d
d is a dictionary that maps from each value in the suite to the number of intervals it appears in. The loop computes intervals for several percentages and modifies d.
Figure 9.5 shows the result. The 25% credible interval is the darkest region near the bottom wall. For higher percentages, the credible interval is bigger, of course, and skewed toward the right side of the room.
9.8 Discussion
This chapter shows that the Bayesian framework from the previous chapters can be extended to handle a two-dimensional parameter space. The only difference is that each hypothesis is represented by a tuple of parameters.
I also presented Joint, which is a parent class that provides methods that apply to joint distributions: Marginal, Conditional, and MakeLikeInterval. In object-oriented terms, Joint is a mixin (see http://en.wikipedia.org/wiki/Mixin).
There is a lot of new vocabulary in this chapter, so let’s review:
- Joint distribution:
- A distribution that represents all possible values in a multidimensional space and their probabilities. The example in this chapter is a two-dimensional space made up of the coordinates alpha and beta. The joint distribution represents the probability of each (alpha, beta) pair.
- Marginal distribution:
- The distribution of one parameter in a joint distribution, treating the other parameters as unknown. For example, Figure 9.2 shows the distributions of alpha and beta independently.
- Conditional distribution:
- The distribution of one parameter in a joint distribution, conditioned on one or more of the other parameters. Figure 9.4 shows several distributions for alpha, conditioned on different values of beta.
Given the joint distribution, you can compute marginal and conditional distributions. With enough conditional distributions, you could re-create the joint distribution, at least approximately. But given the marginal distributions you cannot re-create the joint distribution because you have lost information about the dependence between variables.
If there are n possible values for each of two parameters, most operations on the joint distribution take time proportional to n2. If there are d parameters, run time is proportional to nd, which quickly becomes impractical as the number of dimensions increases.
If you can process a million hypotheses in a reasonable amount of time, you could handle two dimensions with 1000 values for each parameter, or three dimensions with 100 values each, or six dimensions with 10 values each.
If you need more dimensions, or more values per dimension, there are optimizations you can try. I present an example in Chapter 15.
You can download the code in this chapter from http://thinkbayes.com/paintball.py. For more information see Section 0.3.
9.9 Exercises
The analysis in this chapter suggests that a shooter is most likely to hit the closest wall. But in reality, if the opponent is close to a wall, he is unlikely to shoot at the wall because he is unlikely to see a target between himself and the wall.
Design an improved model that takes this behavior into account. Try to find a model that is more realistic, but not too complicated.


